
Forex Time Frame Alignment: Why You Only Need Two Charts to Win
Tired of juggling 6 charts just to place one trade? You only need 2: one HTF for bias, one LTF for execution. This blog breaks down the psychology and logic behind simplifying your Forex workflow for sniper-level precision. Stop overanalyzing start executing.
If you’re staring at 4–6 different time frames hoping for the stars to align, let me save you some time and screen fatigue:
You don’t need 4 charts. You need 2.
One for bias, and one for precision.
That’s it.
This article breaks down why traders overcomplicate time frame analysis, how to simplify your execution workflow, and how mastering just two time frames can lead to sniper-level precision in Forex.
Let’s get into it.
What Is Time Frame Alignment in Forex?
Time frame alignment is the process of ensuring that your trading idea, bias, and execution are all flowing in the same direction across multiple time frames.
But here’s the problem:
Most traders think they need to consult the 1M, 5M, 15M, 1H, 4H, Daily, and Weekly… just to justify one trade.
That’s called analysis paralysis, not mastery.
You’re not a fortune teller. You’re a precision assassin. And assassins don’t need six maps to hit a single target.
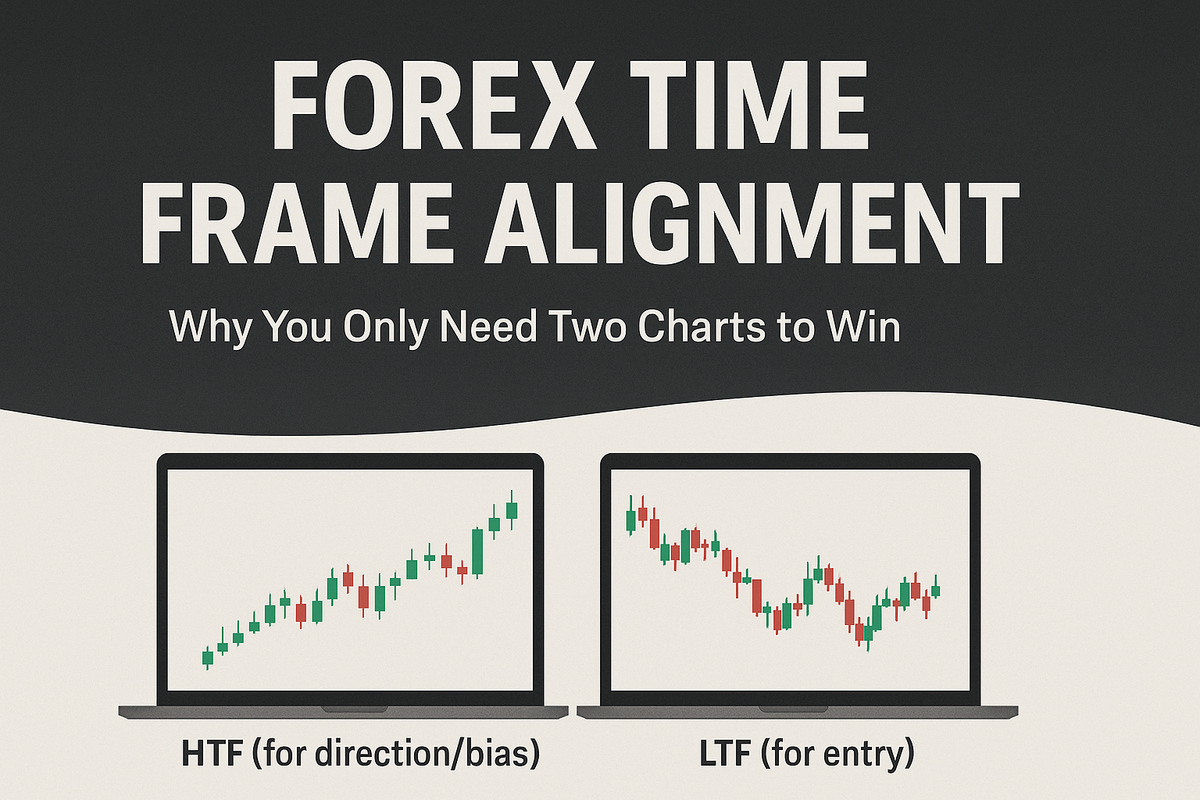
The Golden Rule: 1 HTF + 1 LTF
Instead of juggling too many perspectives, you only need two lenses:
✅ 1. HTF – High Time Frame (for direction/bias)
This is where you identify:
- Market structure
- Liquidity pools
- Order blocks / FVGs
- Expansion vs consolidation
- Where price wants to go (narrative)
Recommended HTFs:
- 1HR if you’re a day/swing trader
- 4HR or Daily if you’re position trading
The HTF is your compass. It tells you whether you should be hunting buys or sells today. Nothing more, nothing less.
✅ 2. LTF – Low Time Frame (for entry)
This is where you enter with precision. You’re looking for:
- Entry model confirmation (breaker, FVG, market structure shift)
- Risk placement
- Entry candle logic
- Refined liquidity sweeps
Recommended LTFs:
- 1M to 15M for intraday execution
- 5M to 1HR for swing setups
The LTF is your scope. You don’t need it for storytelling you need it to pull the trigger.
Why More Charts = More Confusion
Every time frame tells a different version of the truth. But unless you know what you’re looking for, they’ll just contradict each other and ruin your confidence.
Here's what happens when you're looking at too many time frames:
- 15M says bullish
- 1HR looks choppy
- 4HR shows bearish structure
- Daily is consolidating
Now you’re confused, hesitant, and late on your entries.
By the time everything “aligns,” the move is gone and you're chasing.
Trading isn't about being right on all time frames. It's about being precise in one narrative.
Psychology of Simplicity: Clarity Builds Confidence
There’s a psychological edge to trading with fewer charts:
- You reduce decision fatigue
- You focus on one bias at a time
- You eliminate second-guessing
- You enter and exit with clarity
Simplifying your system doesn’t weaken it.
It refines it.
And in this game, confidence is your most dangerous weapon. When you stop jumping between six charts, your execution gets cleaner, tighter, deadlier.
How I Trade With Just Two Charts
Here’s my personal workflow as a trader who’s building funded accounts and precision systems:
Step 1: Start With HTF (1HR)
I mark:
- Directional bias (bullish/bearish)
- Liquidity magnets (equal highs/lows, FVGs)
- Order blocks / breaker zones
- Draw on liquidity narrative
My question is simple:
“Where is price likely to attack or reject today?”
Step 2: Drop to LTF (15M or 1M)
I wait for:
- SMT divergence (if using correlated pairs)
- Liquidity sweeps into HTF zones
- Market structure shift or breaker
- FVG + entry model confirmation
Once confirmed?
Execute. With precision.
No back and forth. No confusion. Just HTF tells me where, LTF tells me when.
Why This Works: Market Logic Over Indicators
The market is a story of liquidity. If your HTF shows that price is reaching up into a daily FVG or a 1HR buy-side liquidity pool, your job is not to guess—your job is to stalk the entry like a sniper.
The LTF confirms that the trap has been set.
Example:
- HTF bias: Bearish, price reaching into a 1HR breaker block
- LTF: Price sweeps buy-side liquidity → market structure breaks → 15M FVG forms
Now what?
Short with sniper precision.
Your stop is clean. Your risk is low. Your confidence is high.
FAQs About Time Frame Simplicity
❓ But what if the HTF and LTF don’t align?
Then you wait. No signal = no trade. This isn’t a game of “maybe.” It's war. And war requires discipline.
❓ What if I miss the move waiting for confirmation?
Then you miss the move. But missing is better than bleeding. Most traders die from overtrading, not undertrading.
❓ Isn’t the Daily or Weekly important for macro bias?
Sure—but unless you’re swing trading multi-day setups, it's usually just noise. Stick to what’s relevant for your trading horizon.
❓ What about scalping?
Same rules apply. HTF might be 15M or 5M, and LTF might be 1M or 15s. It’s not about the time—it’s about the relationship between bias and entry.
The Bottom Line
You don’t need six charts to be successful.
You need one time frame that tells you where…
And one that tells you when.
Simplify the workflow.
Master the narrative.
Execute with precision.
Because real traders don’t chase moves.
They hunt opportunities.